


Social media’s introduction has permanently altered marketing. Marketing accounts for five to twelve percent of total sales in today’s business world, with B2C spending outpacing B2B. Business intelligence (BI) is the process of making decisions based on useful conclusions drawn from data.
It serves as the foundation for forward-thinking businesses’ marketing initiatives. Businesses may use BI tools to analyze market trends, measure the success of their marketing initiatives, and find fresh chances for expansion. Business intelligence (BI) tools are categories of software applications that gather and analyse massive volumes of unstructured data from both internal and external systems, including books, journals, papers, health records, photos, files, emails, videos, and other business sources.
Business intelligence offer a technique of gathering data to locate information mostly through queries, though they are less versatile than business analytics tools. In order to build reports, dashboards, and data visualisations, these Business intelligence tools also assist in preparing data for analysis. The outcomes empower both staff members and managers to make decisions faster and better, run operations more efficiently, uncover new income prospects, spot market trends, provide accurate KPIs, and discover new business opportunities.
What are business intelligence Tools?
Software known as a business intelligence (BI) tool gathers, transforms, and displays data to assist decision-makers in fostering business success. Business intelligence or BI tools take in large amounts of structured and unstructured data from many different sources. They then change the data and help get useful business insights from it.


Business Intelligence Tools In 2022
Here is a list of the top BI tools, along with information on how to download each program. Both open source (free) and proprietary (paid) software are included in the list.
1. Microsoft Power BI
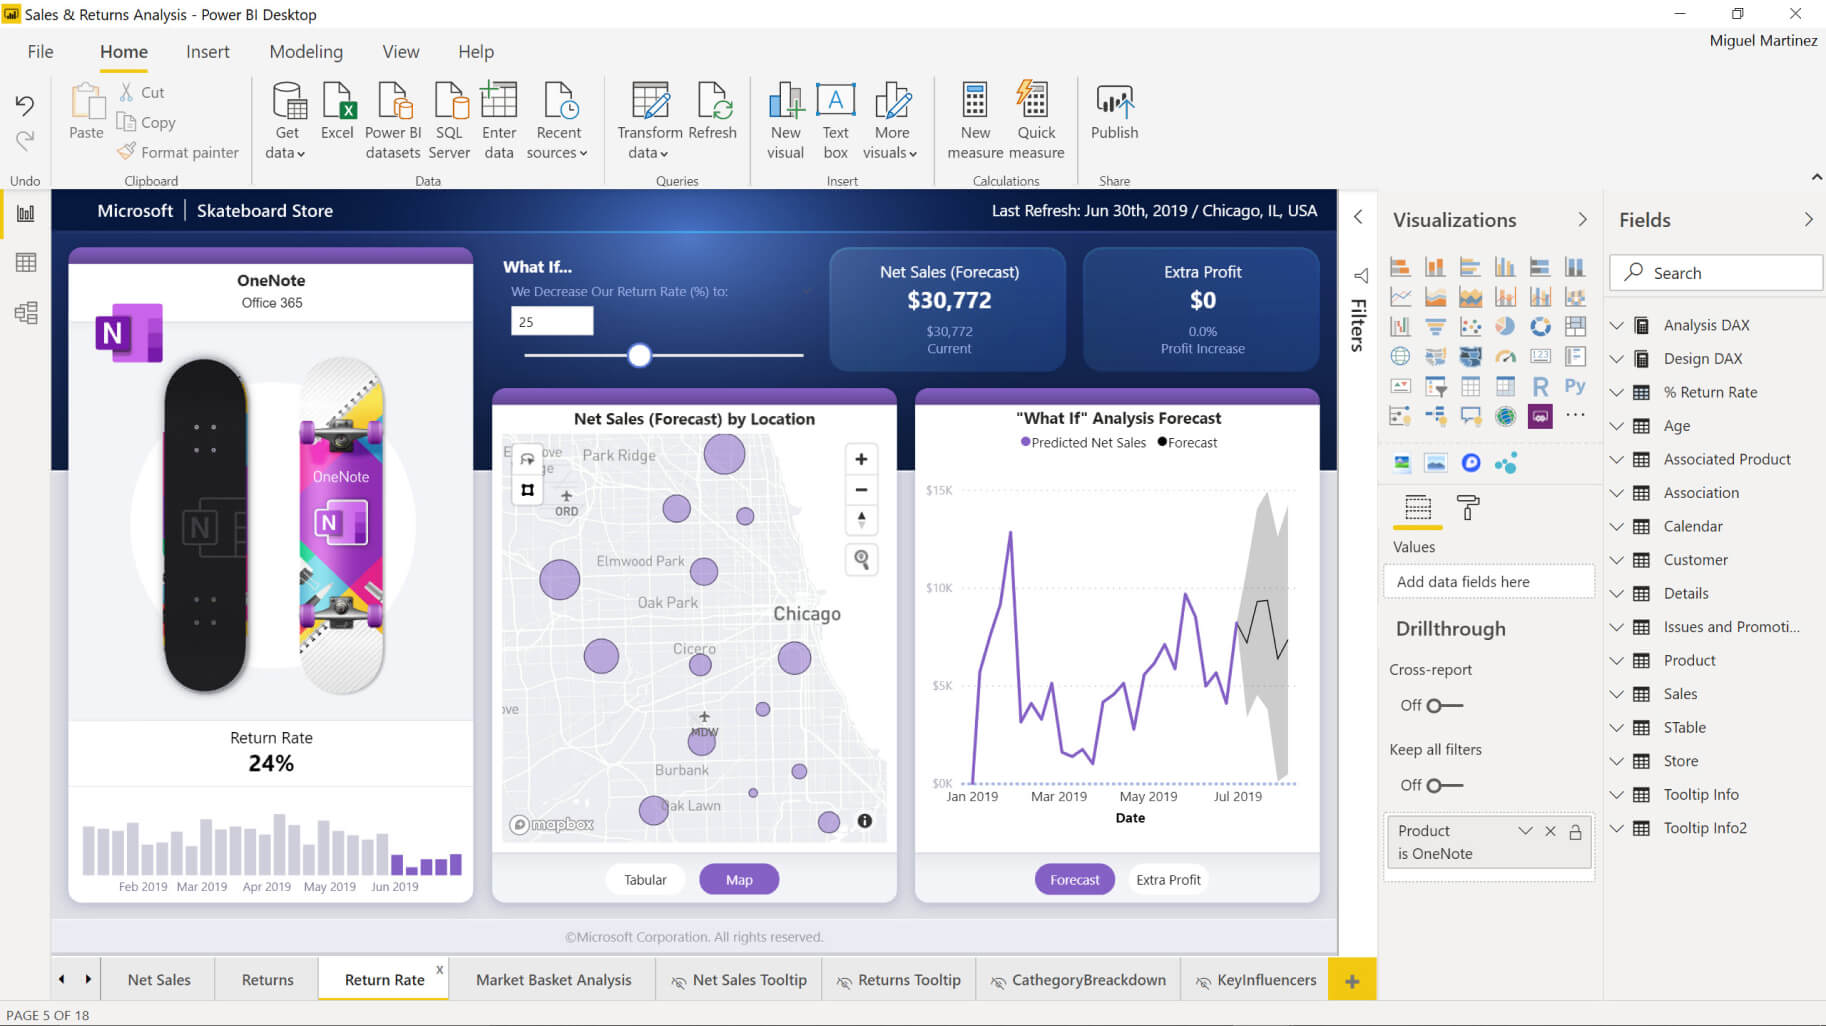

Microsoft’s BI suite has interactive business intelligence features that help marketers create dashboards and reports. Power BI, which was introduced in 2011, has a desktop-based interface called Power BI Desktop and a cloud-based BI service known as Power BI Services. On the Azure cloud platform, Microsoft offered Power BI Embedded in 2016. Microsoft Power BI has pre-built data connections, tight Excel connectivity, and built-in AI capabilities. It provides real-time access monitoring and end-to-end data encryption.
2. Zoho Analytics
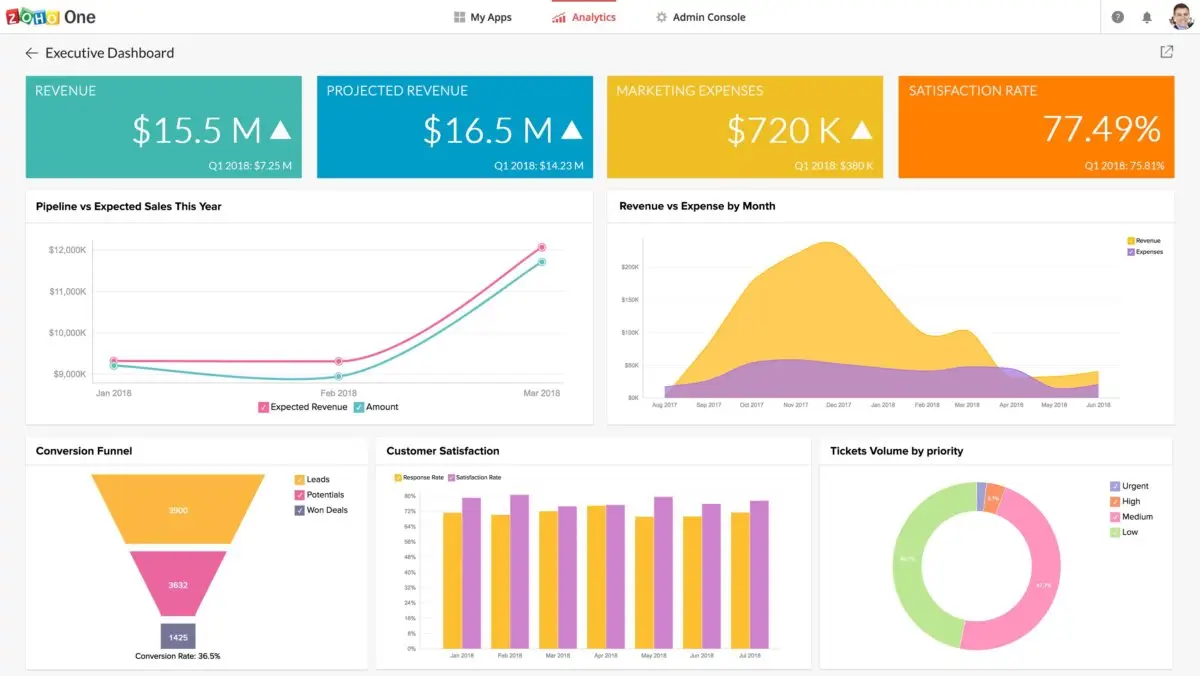

Zoho, an Indian multinational software company, released the BI package Zoho Analytics in 2009. Enterprise reporting and dashboard generation are done using the self-service BI and analytics system. Businesses may analyse data from any source thanks to its automatic data sync capability. Businesses can upload data from flat files, spreadsheets, and online storage systems.Users may also connect to a variety of relational databases, both on-premises and in the cloud. Zia, a capable analytical assistant, leverages NLP and machine learning to provide marketers with quick access to new information. Customers of Zoho Analytics include companies like Dell, Tesla, HP, Ikea, and Canon.
3. Google Data Studio
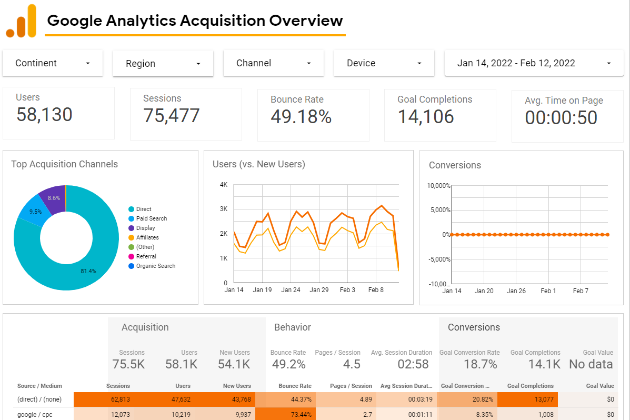

Businesses may transform data into instructive reports and dashboards using Google’s Data Studio. It debuted in 2016 as a component of Google Analytics 360. The user-friendly features of Google Data Studio include formatting existing reports to enable visualisation and specialised solutions; democratising data by enabling sharing and collaboration; and translating data into charts and graphs for deeper insights. There are several built-in marketing templates included.
4. Qlik
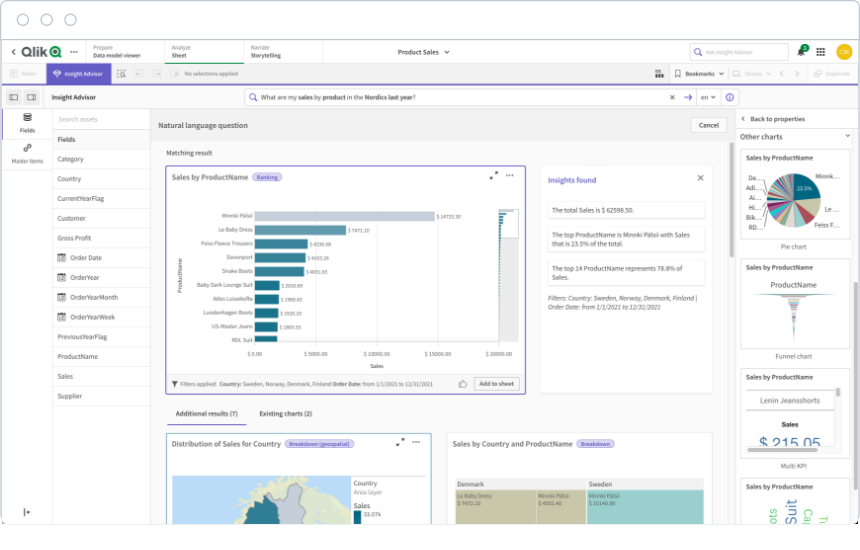

QlikView was introduced in 1994 as the first ever namesake product of Qlik. Businesses may use it to create guided analytics apps and dashboards. Qlik is simple to use and gives marketers the ability to combine, search, visualise, and analyse various data sources to provide insightful data. The product is accessible to marketers worldwide.
5. Tableau
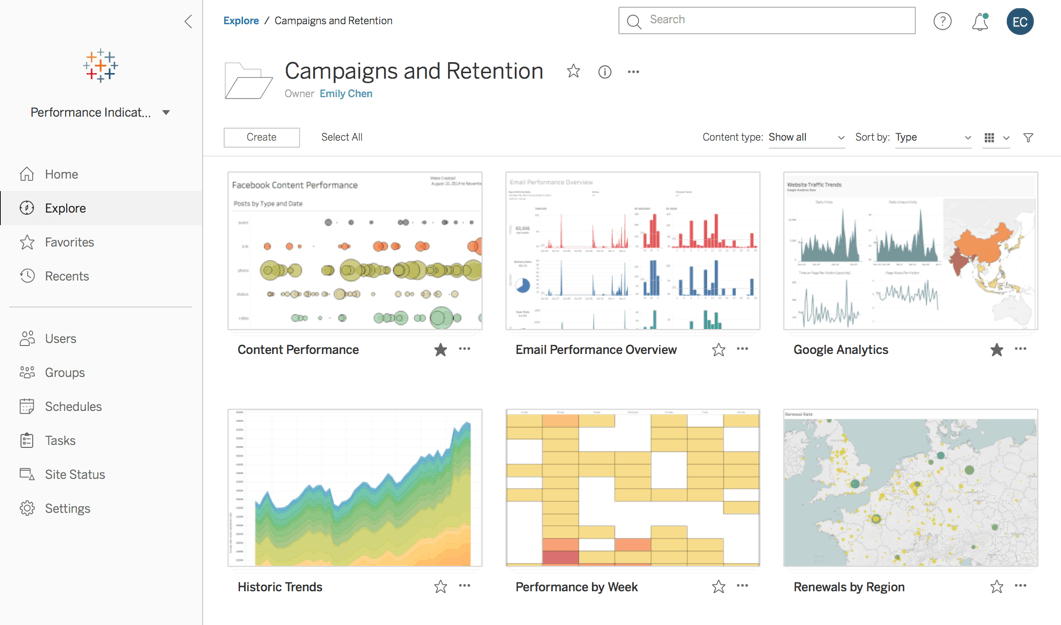

Businesses may use Tableau’s marketing dashboards to consolidate all marketing data in one location and gain useful information about social media presence, consumer behaviour, website performance, and spending. Tableau Prep, Tableau Desktop, Tableau Server, Tableau Online, and Tableau Mobile are all examples of the company’s products. Data exploration is available through Tableau Desktop’s user-friendly interface. Additionally, it uses natural language statistical modelling that is AI-driven.
6. Freshworks CRM
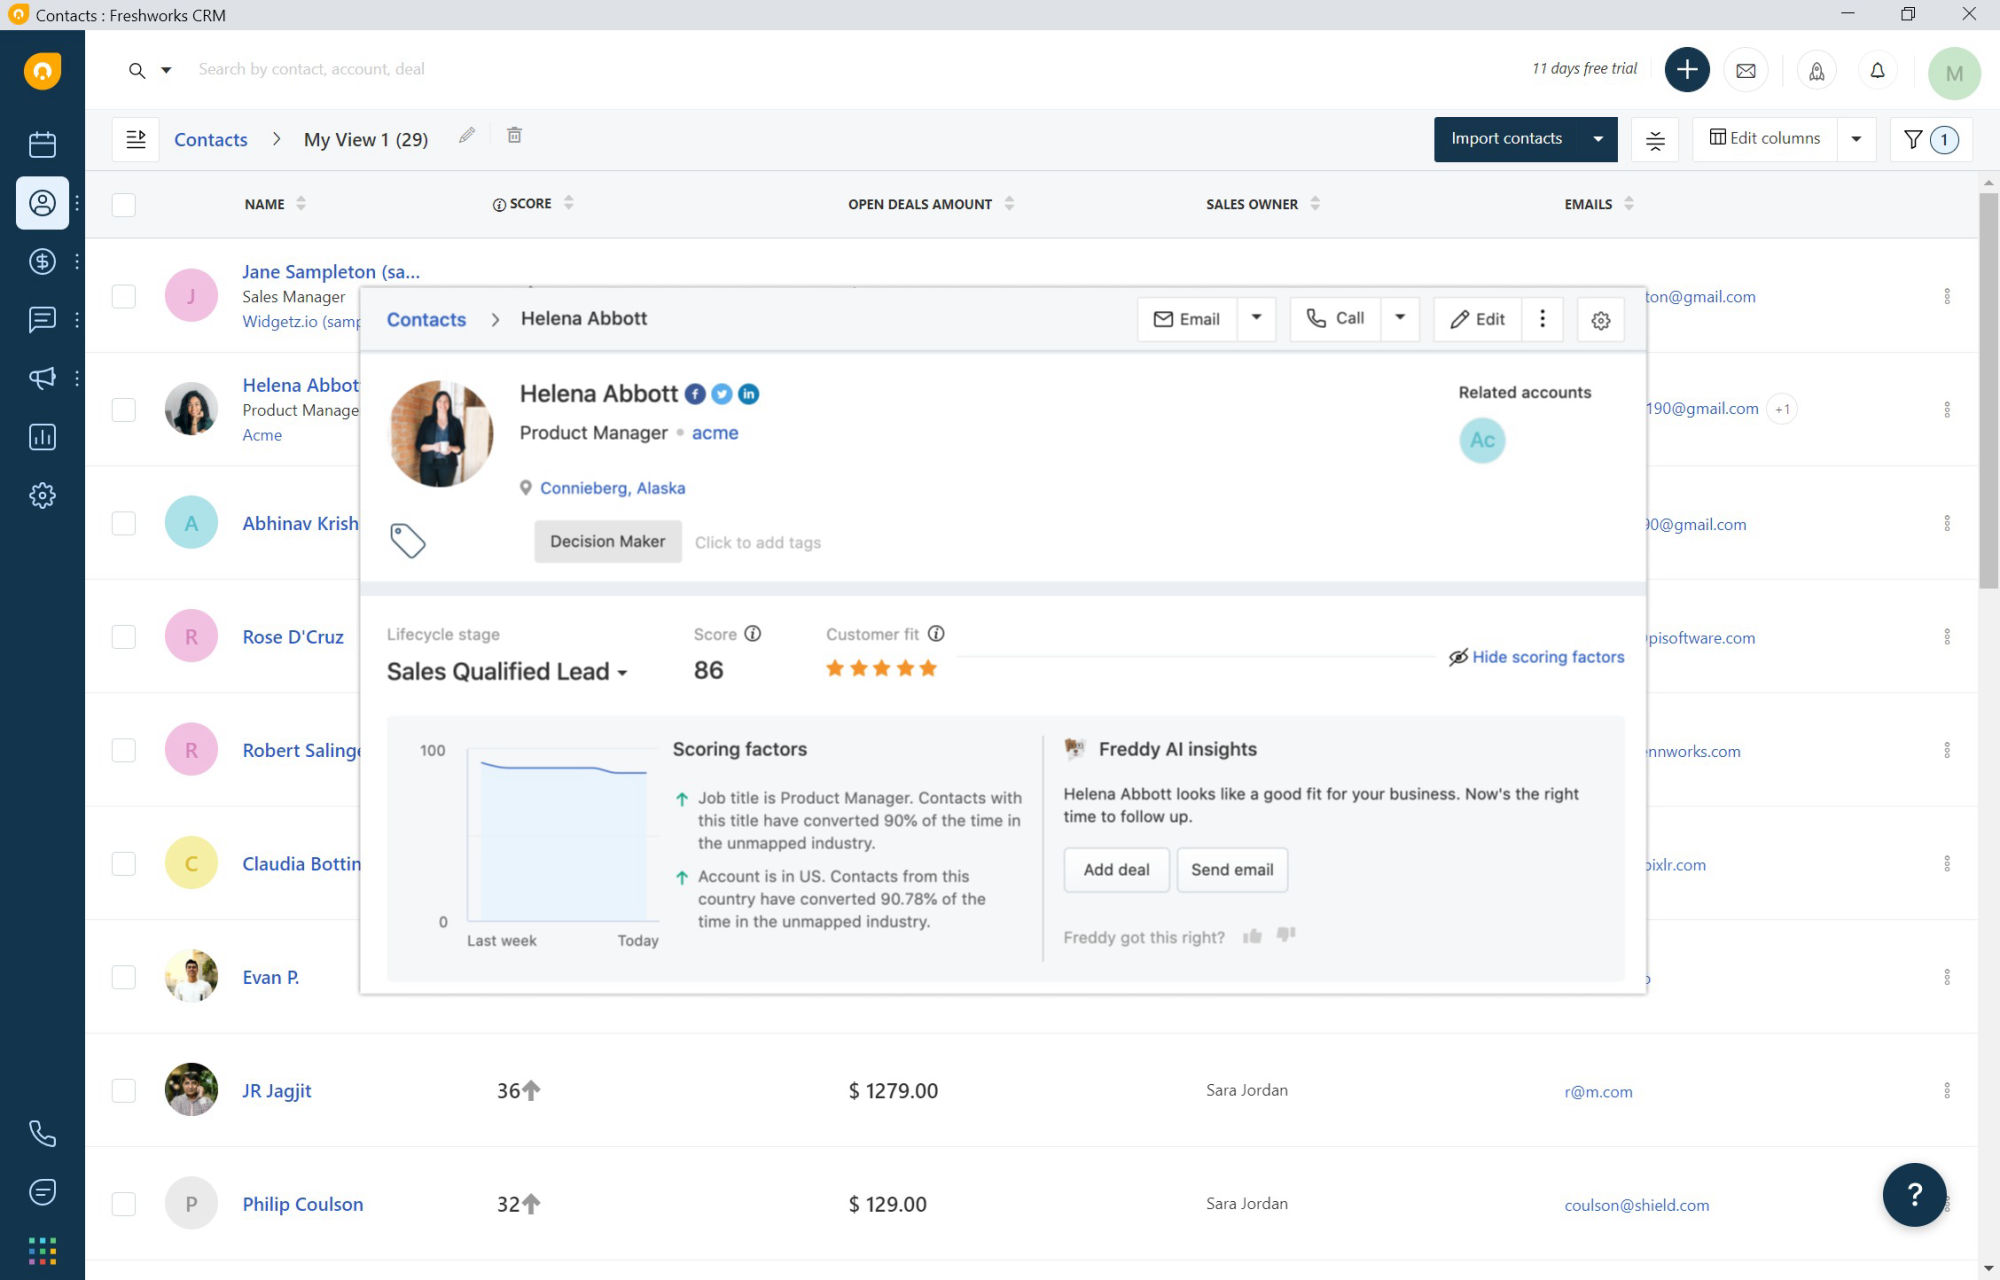
According to Freshworks, organisations may boost website conversions by more than 40%. In 2010, Shan Krishnasamy and Girish Mathrubootham started the Chennai-based firm. Because of the cloud-based customer engagement service provider, businesses can obtain a complete picture of their customers, comprehend customer behavior, and categorise clients into lists and categories. It also lets you divide your customers into groups, keep track of events, use email marketing, online forms, chat campaigns, and optimise your conversion rate.
7. HubSpot
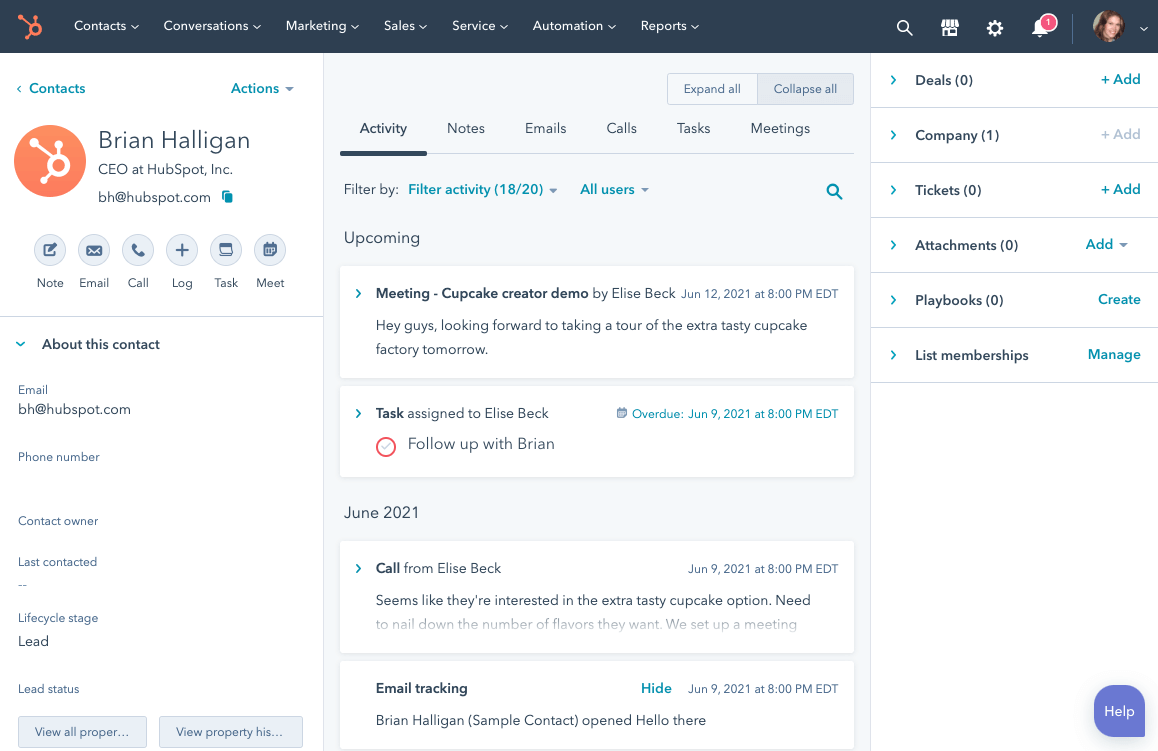

By integrating all CRM contact, business, and deal data with marketing, sales, and service data, HubSpot makes it simple to create customised reports. Dharmesh Shah and Brian Halligan created it in 2006. Through the HubSpot App Marketplace, businesses can connect their apps and use custom objects to put data into the platform. With the aid of blogging, social networking, and advertisements, it functions as an all-in-one inbound marketing tool. With landing sites, email, marketing automation, and ABM, it also aids in consumer conversion. Additionally, HubSpot’s revenue attribution reporting enables the measurement of ROI. VMware, Trello, and SurveyMonkey are just a few of its clients.
8. Looker
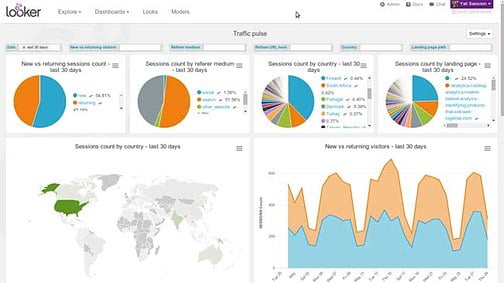
Looker is a platform that helps organisations to centralise their marketing data sources and was founded in 2011 by Lloyd Tabb and Ben Porterfield. Businesses can learn more about their customers by combining multiple data sets, keeping track of how customers behave across channels, and dividing customers into groups based on certain criteria. Looker lets businesses measure key performance indicators (KPIs) like CPC, CTR, and CPA, figure out how much each campaign and marketing channel costs and makes, and set up custom rules to get emails when a strategy or ad doesn’t work.
Additionally, it enables cross-channel attribution analysis, which enables marketing managers to spot trends in consumer behaviour; it permits A/B testing of campaigns by analysing how the business’s variations affect crucial user behaviour based on statistically significant results; and it offers a comprehensive view of users’ experiences—from every click to conversion. Looker helps businesses keep an eye on and improve conversion rates by channel, content, and audience, as well as keep track of where new leads and customers are coming from.
9. Intercom
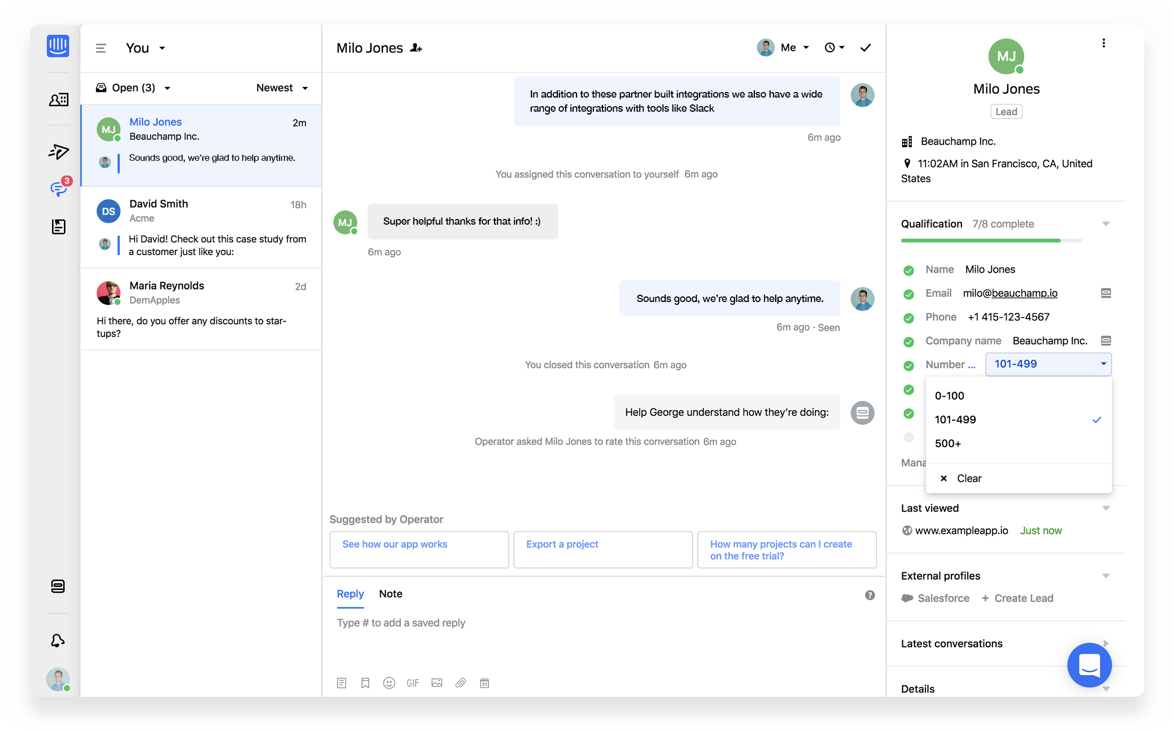

Intercom, which was started in 2011 by Eoghan McCabe, Des Traynor, Ciaran Lee, and David Berrett, lets marketing teams send customised in-app or email messages to new leads in order to find them. Businesses benefit from Intercom’s ability to segment users based on factors like region, income, industry, etc. Account-based marketing, automated responses, and outbound messaging are all helped by it for firms. In the financial, e-commerce, education, and healthcare industries, Intercom uses intelligent bots to improve the customer experience and offers conversational help to organisations of all kinds.
10. DataBox
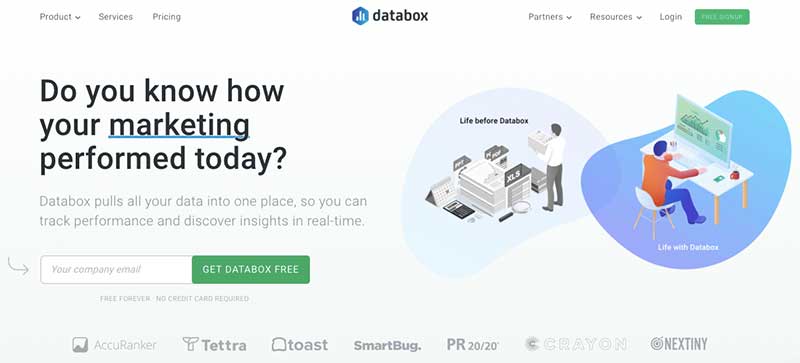

Databox was started in 2011 with its headquarters in Germany. It offers simple, cost-free ways for organisations to measure performance data. DataBox sends out automated morning briefings to let you know how campaigns are going. It also helps marketing teams track trends in acquisition sources using visualizations, and it puts all metrics, no matter where they came from, in one place.
Conclusion:
Big data is all around us and is progressively getting bigger every year. By adopting BI and business analytics tools, you stand to gain a lot. Because these tools have so many different features, your data management will become more unified, reliable, flexible, and predictable. We hoped that our thorough reviews of each product would encourage you to start looking into business intelligence tools and discover one that is the ideal match for your organisation or department. Our goal was to assist you in considering the best tools available. Below is a graphic summary of the top 10 business intelligence tools we think will be important in 2022. This will help you understand and remember what you just read.
FAQ’s
How does business intelligence work?
Organizations gather and maintain a vast amount of recent and old data during the business intelligence process. To make informed and decisive business decisions, they utilise this data and transform it into relevant information. Organizations may improve their decision-making for business growth with the use of business intelligence.
The importance of business intelligence
Business intelligence helps organisations and businesses make better decisions by giving them a better understanding of both current and historical data. Businesses may use it to transform and display vast volumes of organised and unstructured data into informative data to increase productivity and efficiency.